⚡ East Anglia Grid
Executive Summary
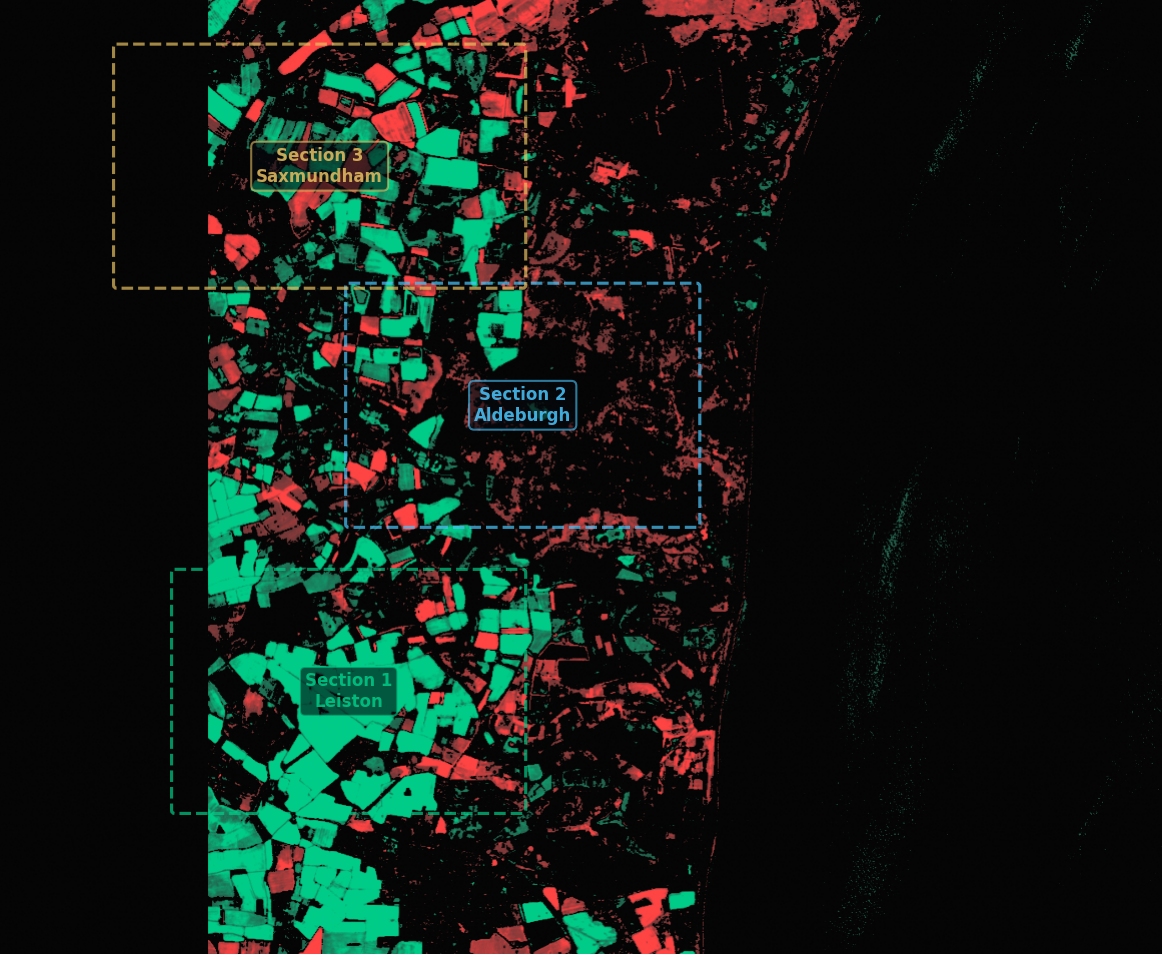
22.9% of the East Anglia corridor shows anomalous vegetation change between summers
22.9% of corridor pixels (297,524 out of 1,299,600) show anomalous change. The mean raw change of +0.033 indicates a net vegetation increase across the corridor year-on-year. This is significant for encroachment monitoring: sections where vegetation grew into clearance zones are directly identifiable. The Leiston section shows concentrated growth, while Saxmundham shows active agricultural change.
Key Metrics
Risk Assessment
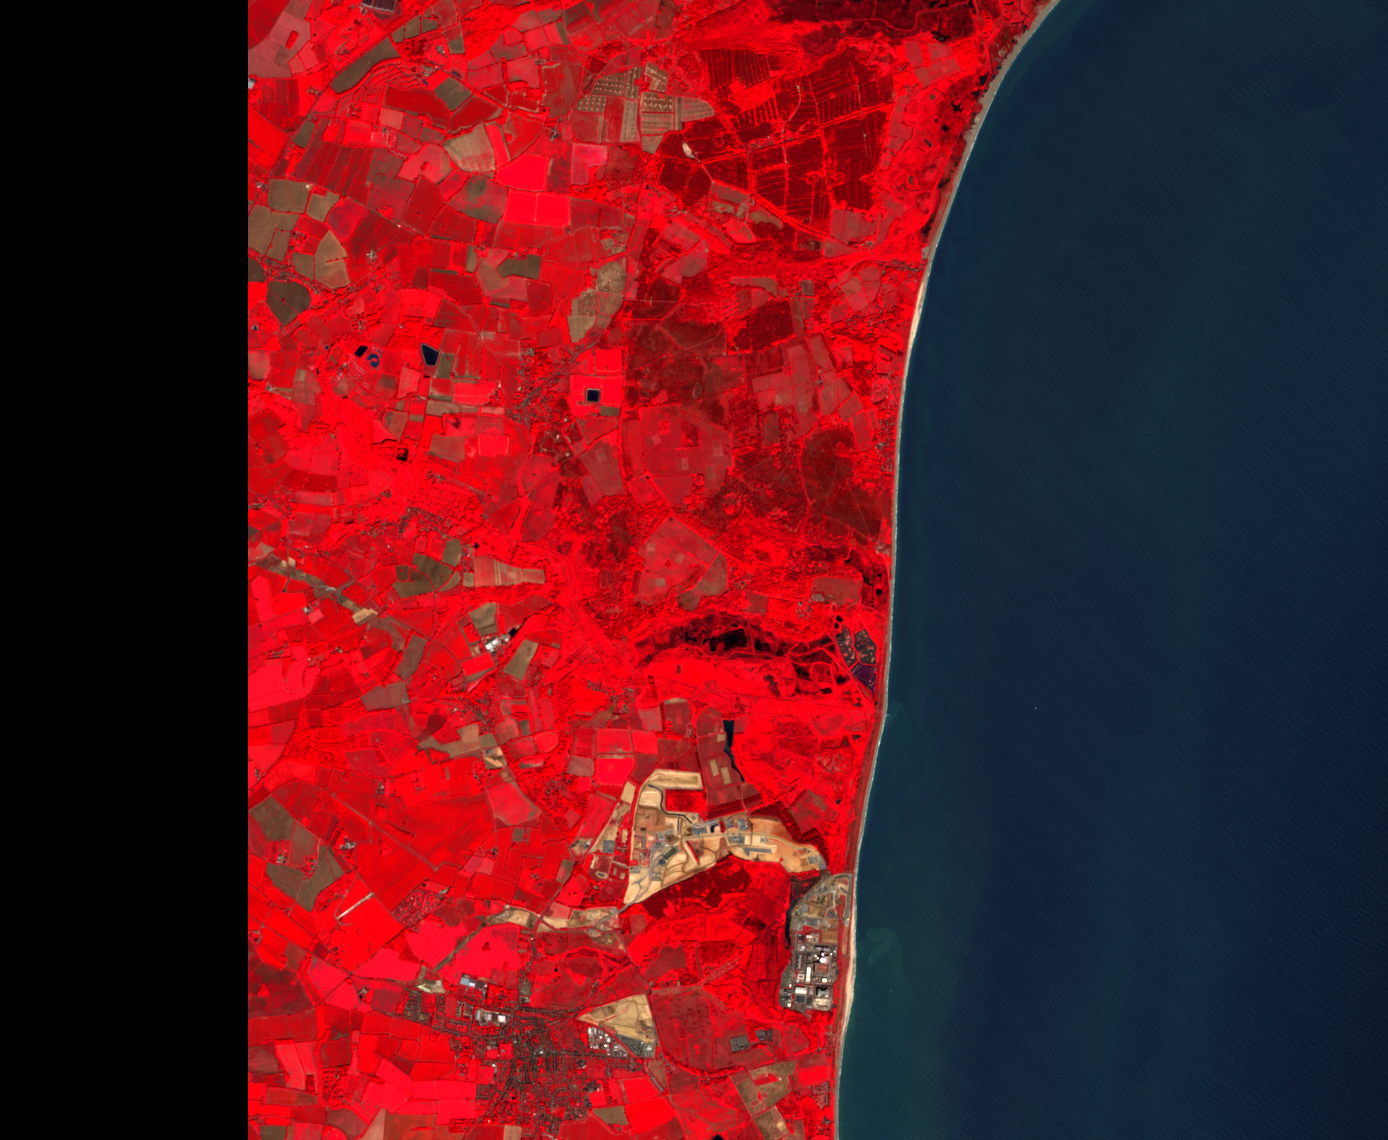
Satellite Imagery
Methodology
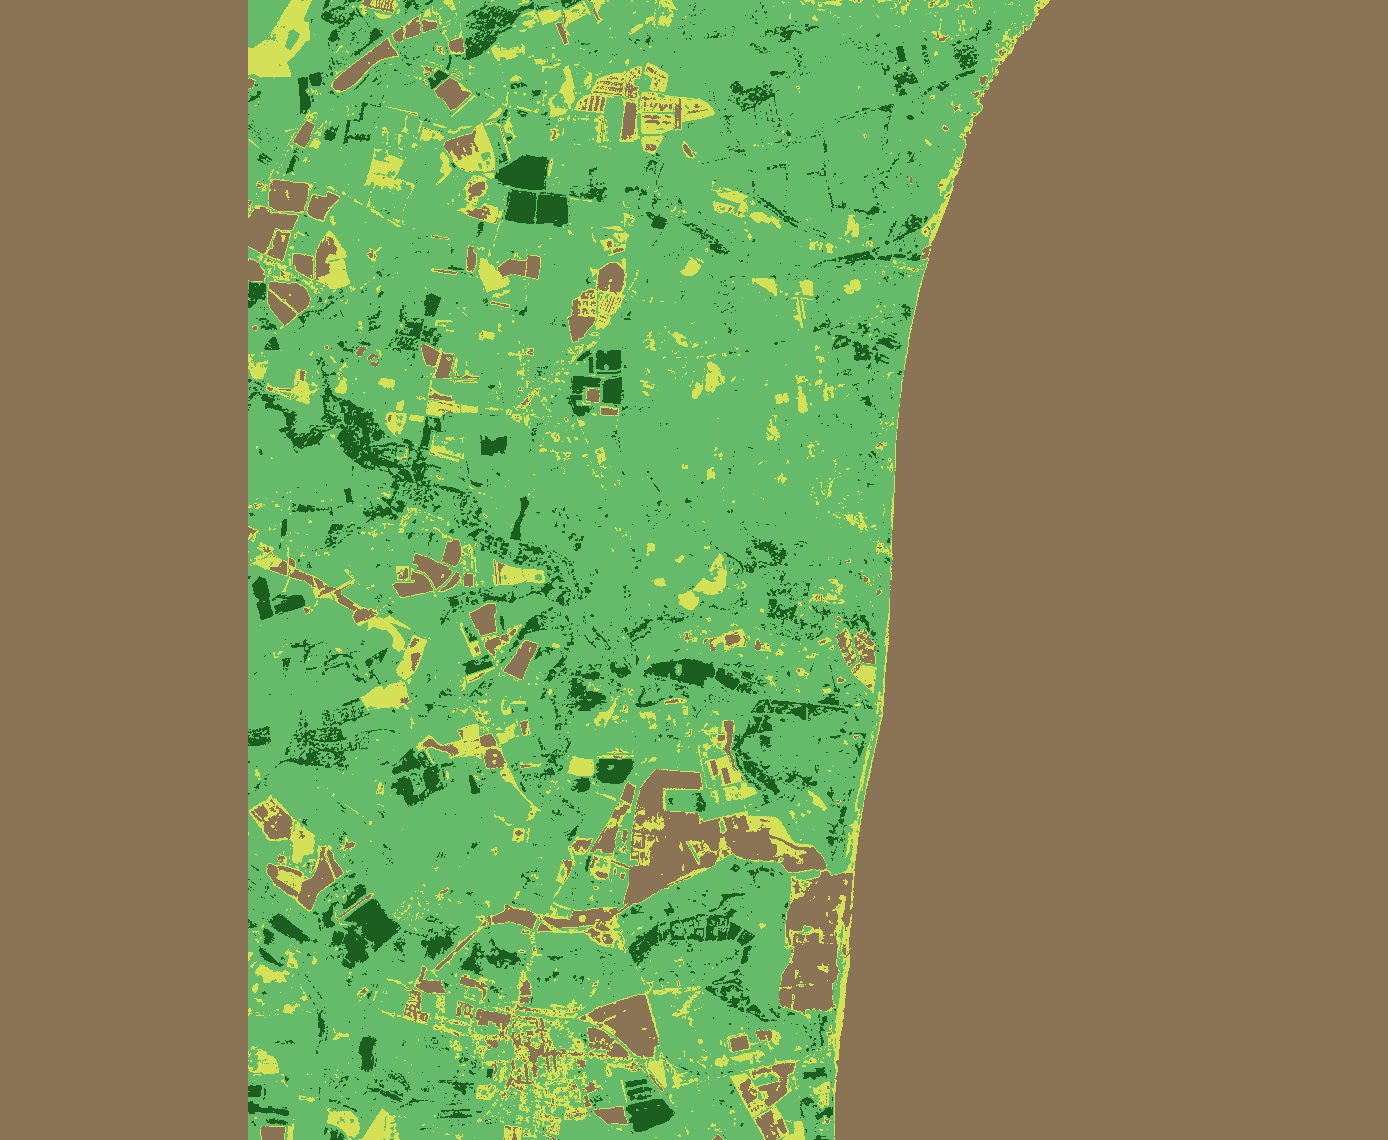
We compared the same corridor in July 2024 and June 2025 (both peak summer) to isolate genuine year-on-year vegetation change. Vegetation density was classified from the summer 2025 capture using four NDVI-based classes. Changes exceeding ±0.08 NDVI are flagged as anomalous — meaning crop rotation, new growth, or deliberate clearance rather than normal seasonal variation.
Confidence note: High confidence: same-season comparison eliminates seasonal noise. 94% cloud-free coverage. Anomaly threshold (+/-0.08 NDVI) filters sub-threshold variation.
Commercial Value
Satellite-based corridor screening could reduce vegetation management costs by 40–55% while detecting encroachment 10x faster than current helicopter survey cycles.
Strategic Implications
Satellite screening every 12 days can identify which corridor sections need priority ground inspection, replacing blanket helicopter surveys. For National Grid, this converts reactive patrol-based clearance into predictive, risk-prioritised management — directly supporting Ofgem’s Net Zero efficiency targets and reducing operational cost per km of monitored line.