☢ Sellafield
Executive Summary
33.1% anomalous change at Sellafield — the NDA’s primary condition monitoring target
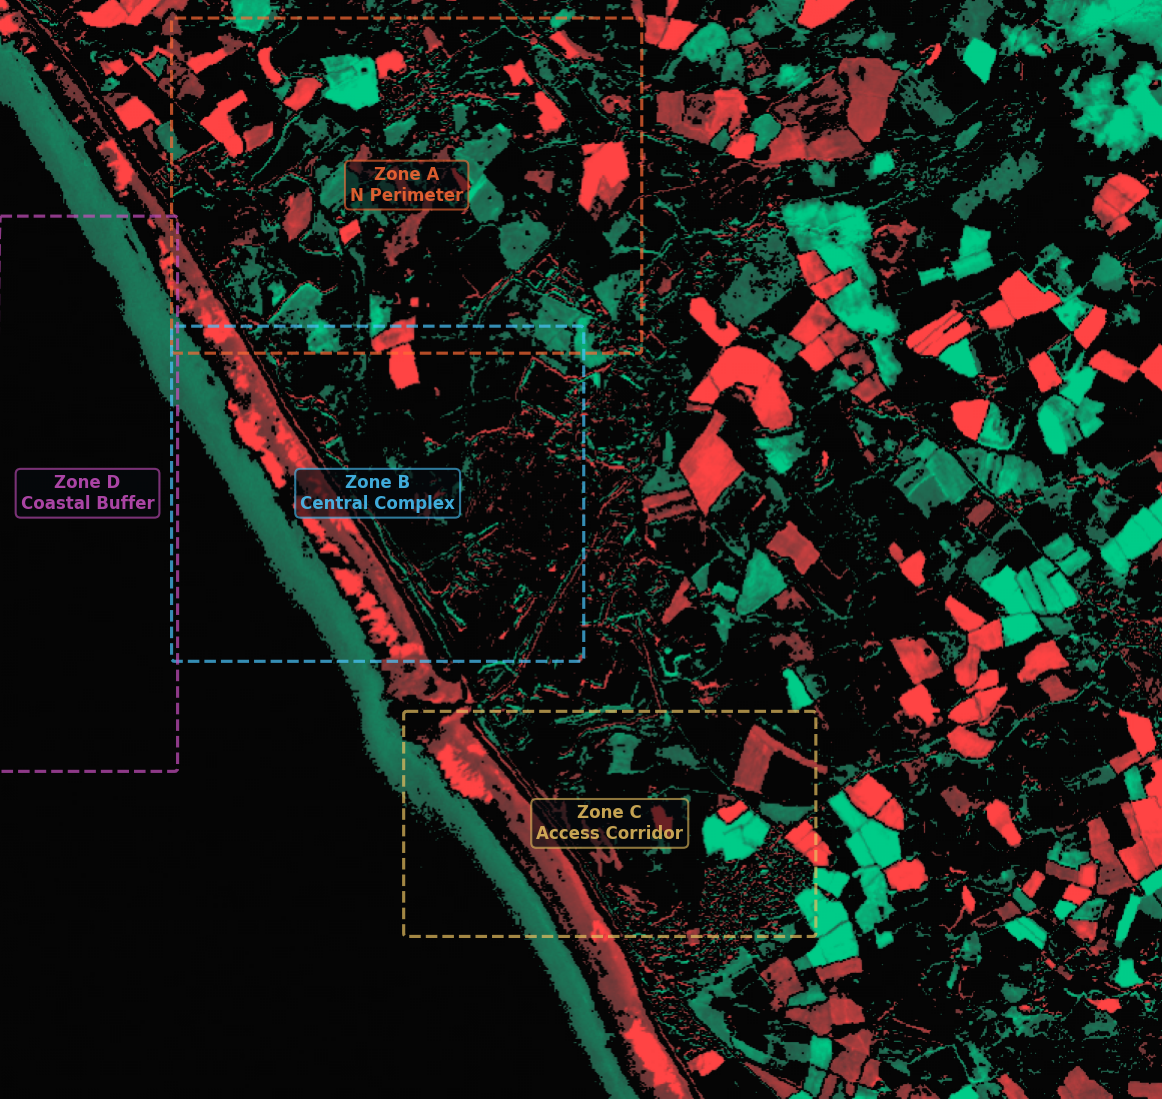
33.1% of monitored pixels (187,984 out of 568,075) show anomalous change. The coastal buffer zone shows the highest anomaly rate (43.6%) driven by coastal erosion and facility-adjacent changes. The NW perimeter shows 39.7% anomalous change consistent with ongoing decommissioning works. The access road area is relatively stable at 10.0% (AMBER), suggesting completed infrastructure.
Key Metrics
Risk Assessment
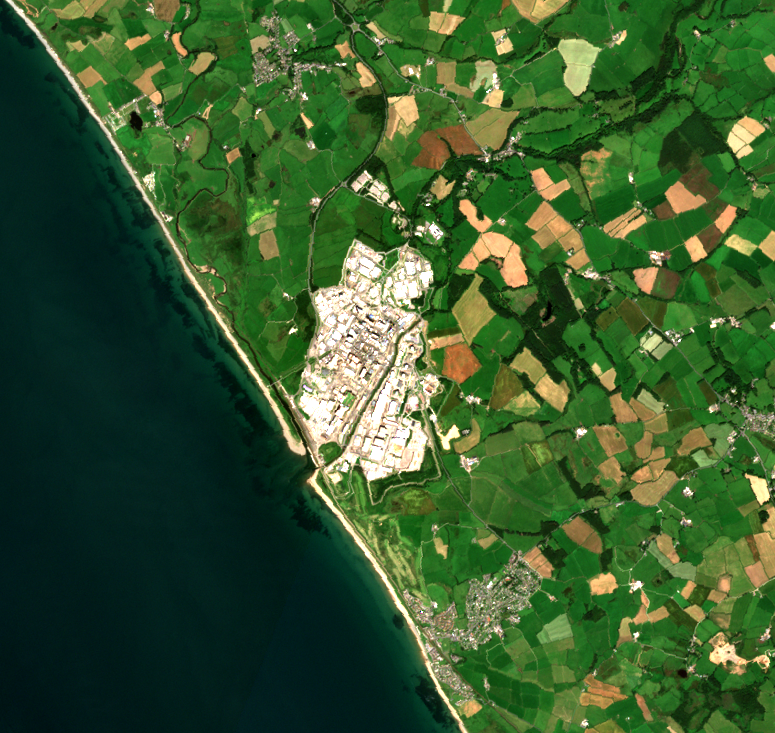
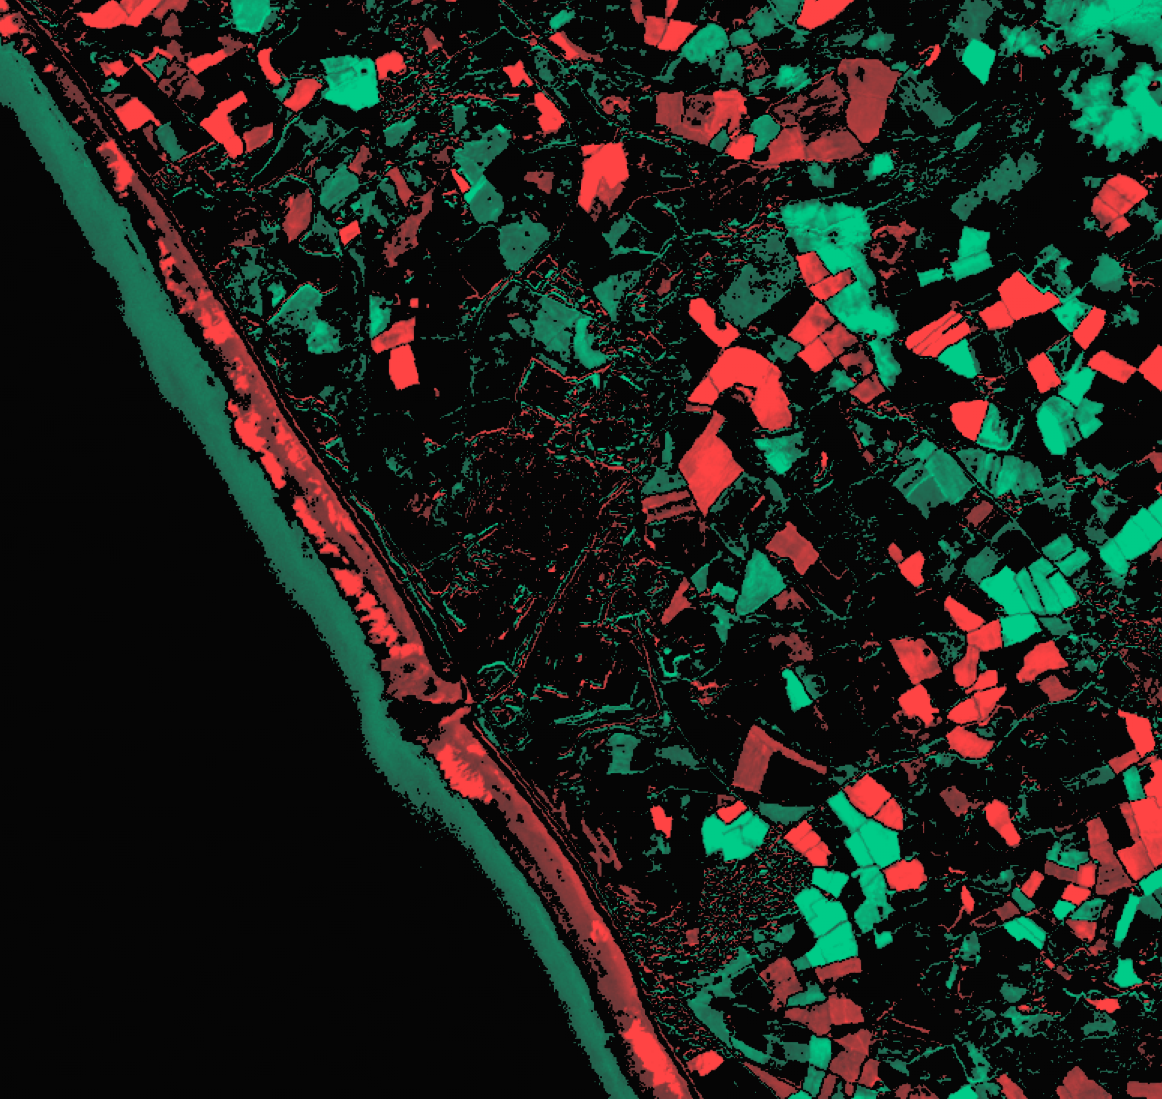
Satellite Imagery
Methodology
Same-season comparison (August 2024 vs July 2025) using Sentinel-2 NDVI analysis. The 33.1% anomalous change rate reflects ongoing decommissioning activity, facility modifications, and environmental changes across the complex. Anomaly threshold of ±0.08 NDVI isolates genuine year-on-year change.
Confidence note: Good confidence despite T1 scene having 12% cloud cover. Same-season methodology is robust. 33.1% anomalous rate is consistent with known decommissioning activity.
Commercial Value
As the NDA’s primary condition monitoring target, Sellafield satellite surveillance could deliver £150k–£250k annual savings on this site alone while providing 12-day continuous monitoring.
Strategic Implications
Sellafield is the direct procurement target for the NDA’s £4.9m Condition Monitoring pipeline. This analysis demonstrates that satellite monitoring can detect and quantify decommissioning-related surface changes at the site, providing continuous 12-day oversight between manual inspections. The ITT closes April 2026 with award expected July 2026.