Hinkley Point C
51.208°N, -3.13°E|Nuclear Condition MonitoringHinkley Point C is a £33bn twin-reactor nuclear new-build in Somerset — the first new nuclear power station in the UK in over 20 years. The site is undergoing massive earthworks, with over 8,000 workers on-site. Monitoring construction progress, perimeter integrity, and environmental impact at this scale requires continuous, wide-area surveillance that manual inspection cannot deliver.
Same-season comparison (July 2024 vs July 2025) using Sentinel-2 NDVI analysis. The high anomaly rate reflects the intensity of construction activity — land clearing, earthworks, new structures, and road construction across the site. Anomaly threshold of ±0.08 NDVI isolates genuine year-on-year change from normal variation.
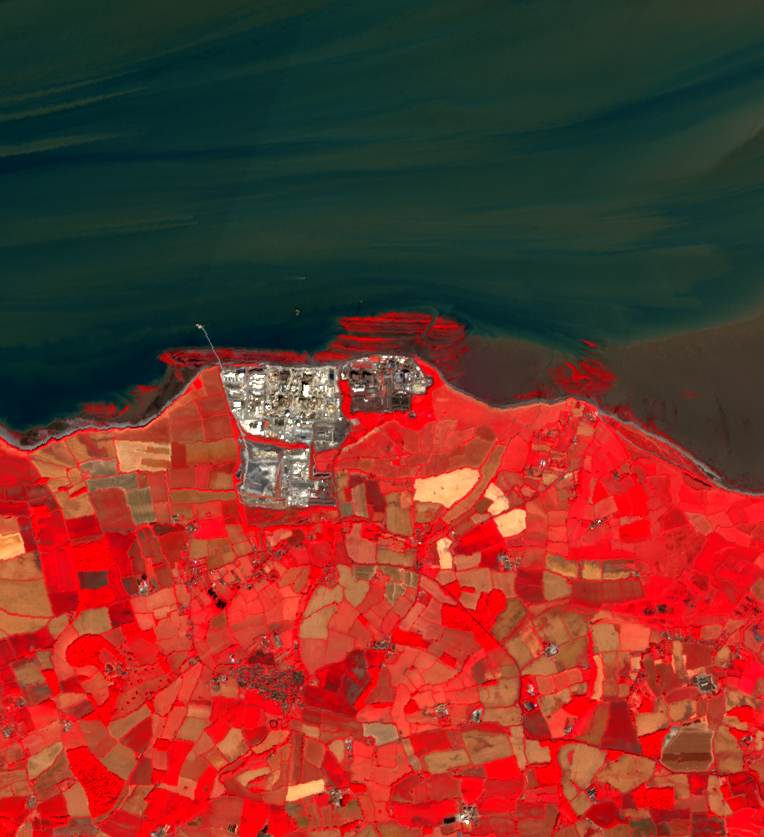
Europe’s largest construction site. The reactor complex (grey/white) is clearly distinguished from surrounding farmland (red = vegetation). Bristol Channel to the north.
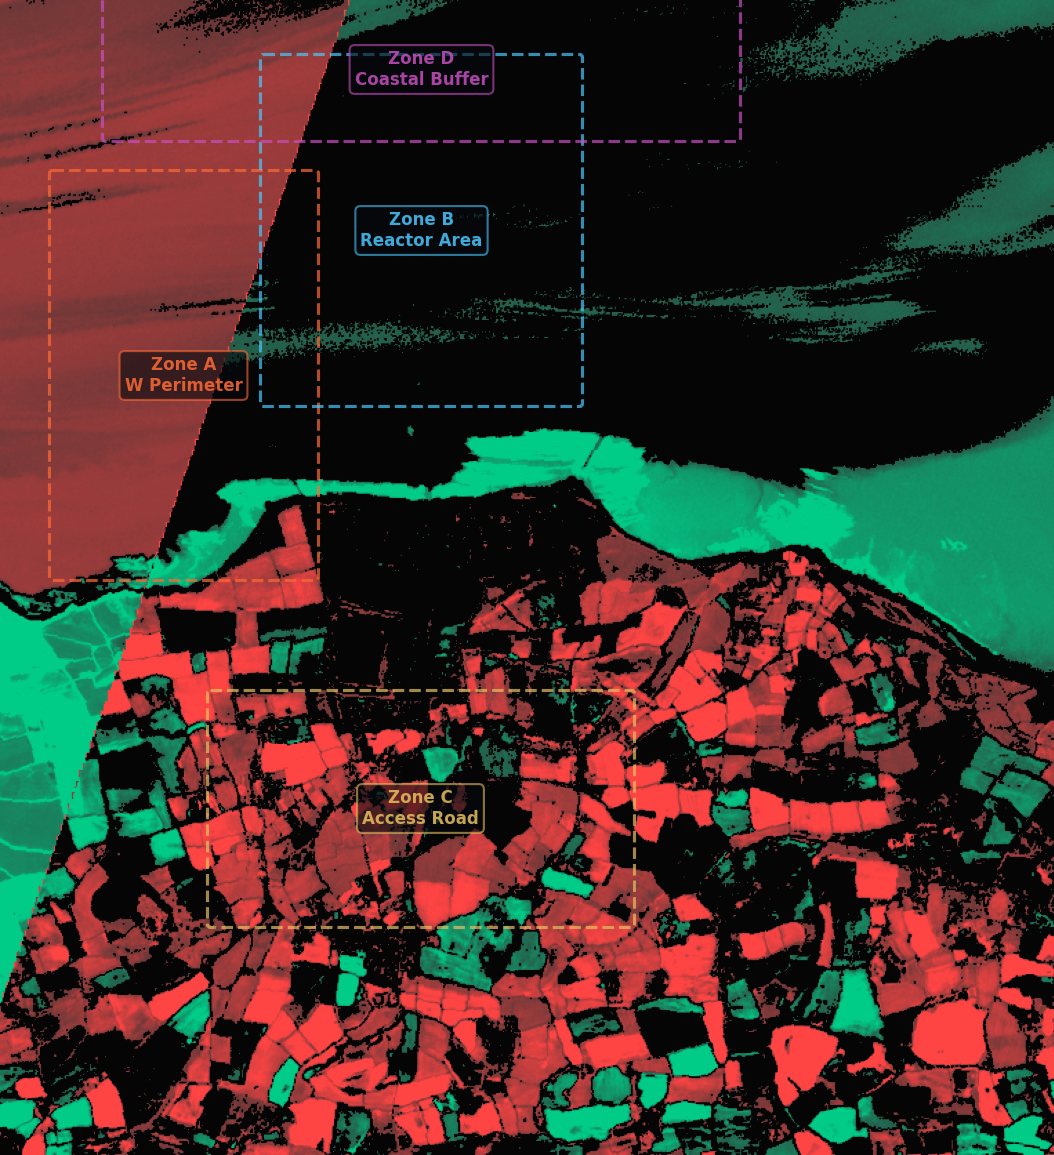
51.2% of pixels show genuine year-on-year change. All four zones flagged RED. Access Road (Zone C) at 65% is the most active. Optical analysis from Sentinel-2.
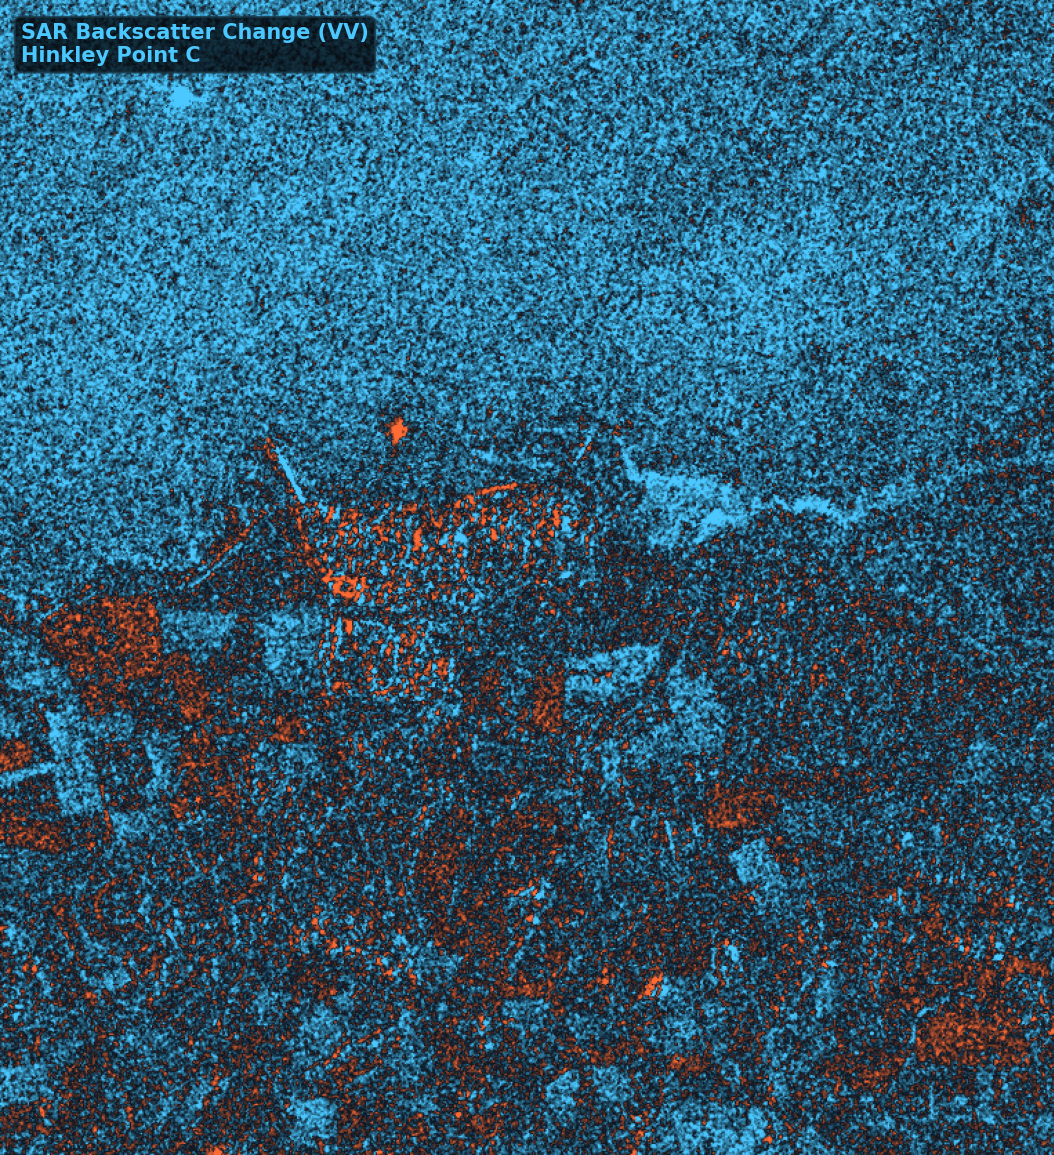
Radar imaging penetrates clouds and works at night. Orange = increased backscatter (new structures, earthworks). Blue = decreased. The construction zone shows concentrated structural change. 47.3% of pixels show significant (>2dB) backscatter change — confirming optical findings independently.
51.2% of monitored pixels show anomalous year-on-year change in optical data — by far the highest rate across our monitored sites. This is independently confirmed by Sentinel-1 SAR radar, which shows 47.3% significant backscatter change (>2dB). The dual-sensor agreement (optical + radar) provides high confidence that detected changes are real structural modifications, not atmospheric artefacts. All four monitoring zones are flagged RED, with the Access Road and Cooling Intake showing the highest change magnitude.
Hinkley validates our detection capability at scale: if the system can accurately characterise change at the most active construction site in Europe, it can reliably monitor any UK nuclear facility. This proves the pipeline generalises across sites, supporting the case for a multi-site monitoring framework under the NDA.
Most active zone on site. 65% anomalous pixels — major road construction and earthworks visible in both RGB and false-colour.
Perimeter expansion detected. 56% anomalous — land clearing extending beyond 2024 footprint.
Coastal infrastructure works. Marine construction activity visible. Cross-reference with EIA.
51.2% anomalous change at Hinkley Point C — the most active nuclear construction site in Europe
Lower confidence reflects the very high anomaly rate (51.2%) — expected for an active mega-construction site but means more pixels are at the noise boundary. Same-season methodology remains robust.
Most active zone on site. 65% anomalous pixels — major road construction and earthworks visible in both RGB and false-colour.
Perimeter expansion detected. 56% anomalous — land clearing extending beyond 2024 footprint.
Coastal infrastructure works. Marine construction activity visible. Cross-reference with EIA.
Result produced by established remote sensing techniques (NDVI, band math). Well-proven, peer-reviewed methods.
Discovery Phase capability. Uses AI foundation models or requires ground-truth calibration. Indicates direction of travel.