Sizewell C
52.2155°N, 1.6195°E|Nuclear Condition MonitoringSizewell C is a £20bn nuclear new-build on the Suffolk coast. The NDA requires continuous condition monitoring of the site perimeter and surrounding land to detect structural changes, security encroachment, and environmental impact. Current methods rely on quarterly manual inspections with 3–6 month reporting gaps.
We compared two Sentinel-2 captures from the same season — July 2024 and June 2025 (both summer) — eliminating seasonal variation as a confounding factor. Any detected change represents genuine year-on-year land-use change, not just winter dormancy. Pixels are only flagged as anomalous if the NDVI change exceeds ±0.08, filtering out normal annual variation in vegetation health.
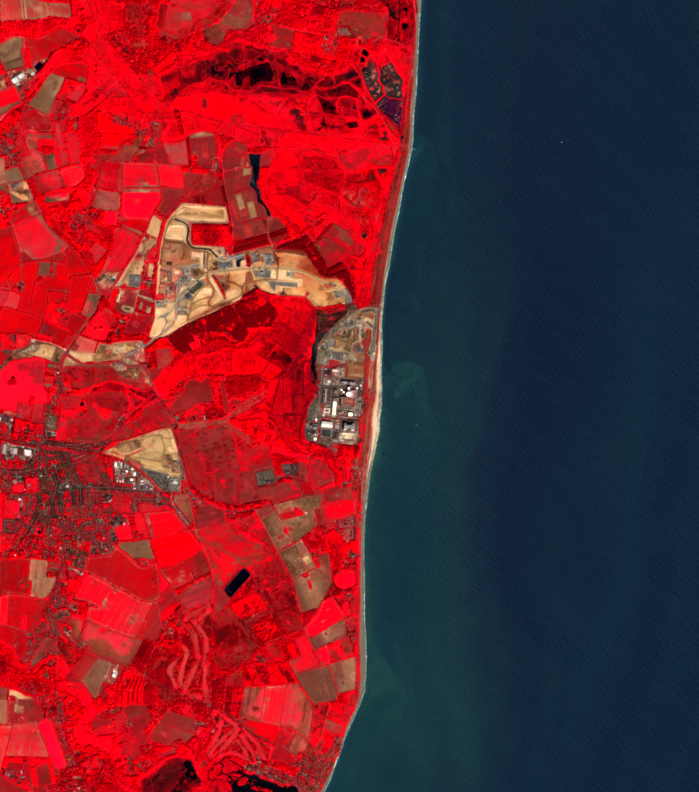
Bright red = healthy vegetation. Grey/white = bare soil, construction, infrastructure. Dark blue = water. The construction zone is clearly distinct from surrounding agricultural land.
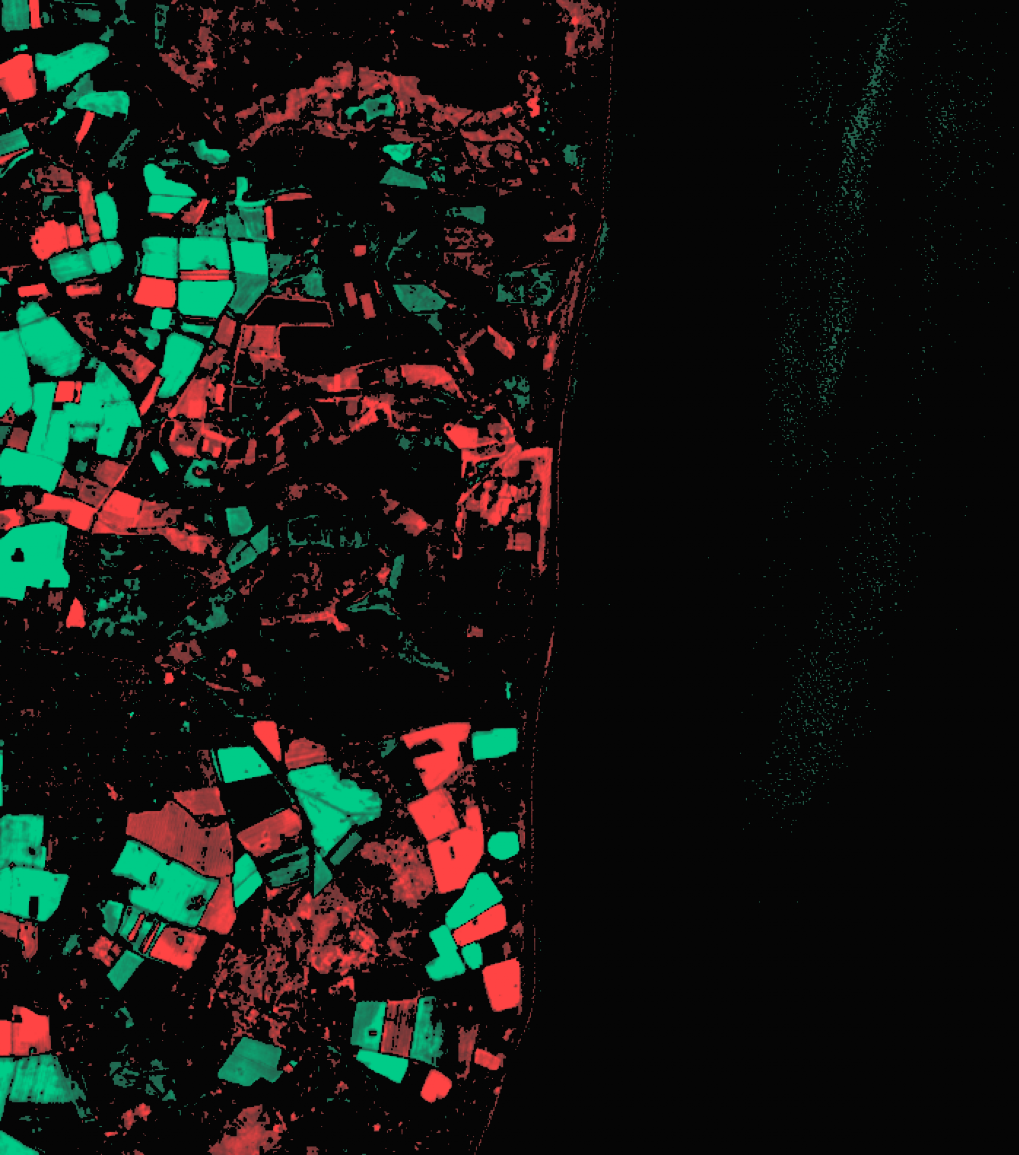
Only pixels that changed more than ±0.08 NDVI between summer 2024 and summer 2025. Green = vegetation increase. Red = vegetation decrease. Black = no significant change (filtered out).
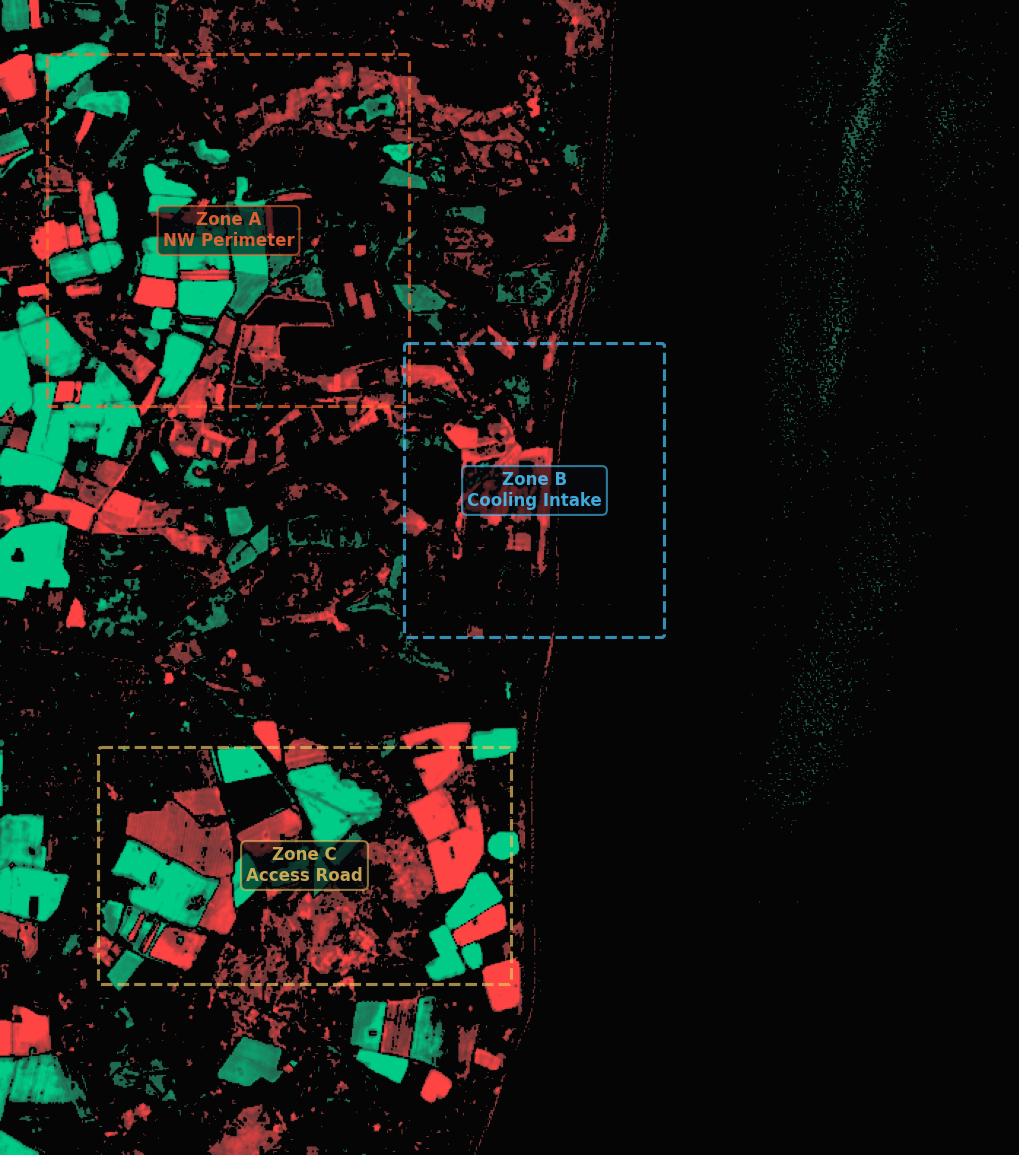
Same anomalous change map with monitoring zones overlaid. Zone A (NW Perimeter) shows encroachment. Zone B (Cooling Intake) shows construction. Zone C (Access Road) shows clearing.
19.5% of monitored pixels (108,101 out of 553,608) show anomalous year-on-year change. This is split between vegetation increase (50,353 pixels — regrowth, crop changes) and vegetation decrease (57,748 pixels — construction, clearing, new infrastructure). The NW perimeter shows concentrated vegetation increase suggesting possible encroachment, while the cooling intake and access road areas show surface disturbance consistent with the construction programme.
Same-season comparison proves that satellite monitoring can distinguish genuine land-use change from seasonal cycles. For the NDA’s £4.9m Condition Monitoring pipeline, this means automated, continuous 12-day surveillance that catches changes between quarterly inspections — a step-change in operational efficiency.
Concentrated vegetation increase around site perimeter. Possible encroachment requires ground verification.
Surface disturbance confirmed year-on-year. Construction footprint expansion visible in both RGB and false-colour.
Ground clearing and new hardstanding detected. Consistent with published works programme.
19.5% of the Sizewell monitoring area shows genuine year-on-year land-use change
High confidence: same-season comparison eliminates seasonal noise. 94% cloud-free coverage. Anomaly threshold (+/-0.08 NDVI) filters sub-threshold variation.
Concentrated vegetation increase around site perimeter. Possible encroachment requires ground verification.
Surface disturbance confirmed year-on-year. Construction footprint expansion visible in both RGB and false-colour.
Ground clearing and new hardstanding detected. Consistent with published works programme.
Result produced by established remote sensing techniques (NDVI, band math). Well-proven, peer-reviewed methods.
Discovery Phase capability. Uses AI foundation models or requires ground-truth calibration. Indicates direction of travel.