Dounreay
58.577°N, -3.74°E|Nuclear DecommissioningDounreay on the Caithness coast is Scotland’s largest nuclear decommissioning project — a former fast reactor research facility. Its remote location and harsh coastal environment make manual inspection particularly expensive and weather-dependent. The site represents the opposite end of the activity spectrum from Hinkley Point C, testing whether the system can distinguish genuine change from background noise.
Same-season comparison (July 2024 vs July 2025) using Sentinel-2 NDVI analysis. At 11.0% anomalous change, Dounreay shows significantly less activity than active construction sites (Hinkley 51.2%, Sellafield 33.1%), which validates the system’s ability to correctly characterise a site in managed decline rather than active construction.
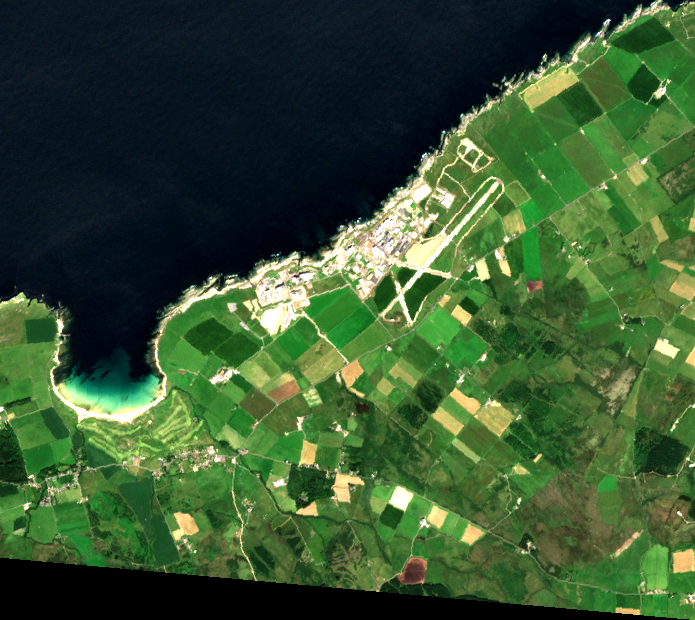
The former reactor complex on the Caithness coast, surrounded by Scottish moorland. Pentland Firth visible to the north. The most remote nuclear site in the UK — manual inspection requires significant travel.
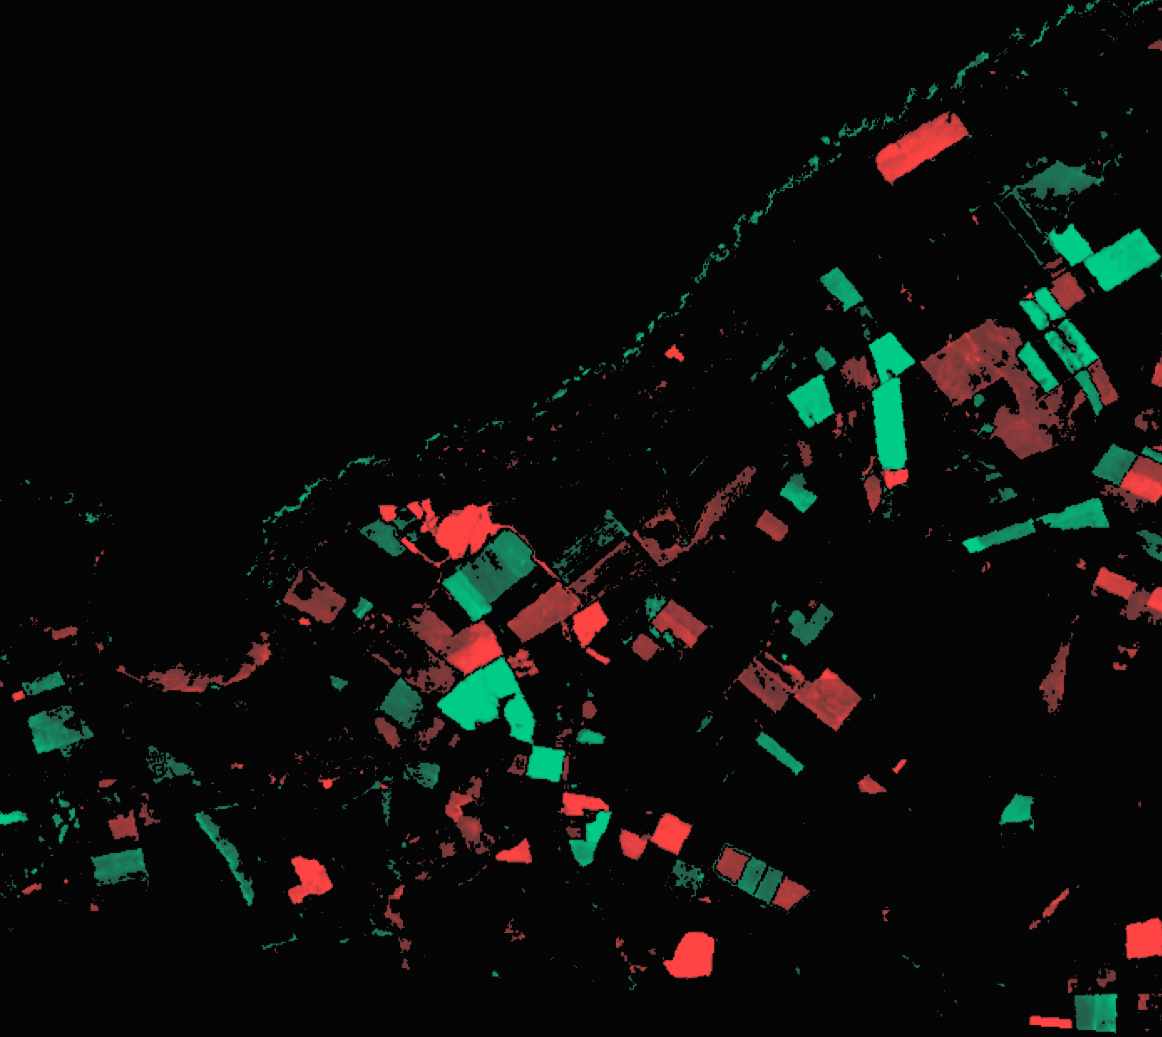
Only 11% anomalous — the lowest across all sites. The dark (stable) areas confirm this is a site in managed decline, not active construction. Change is concentrated in the central complex.
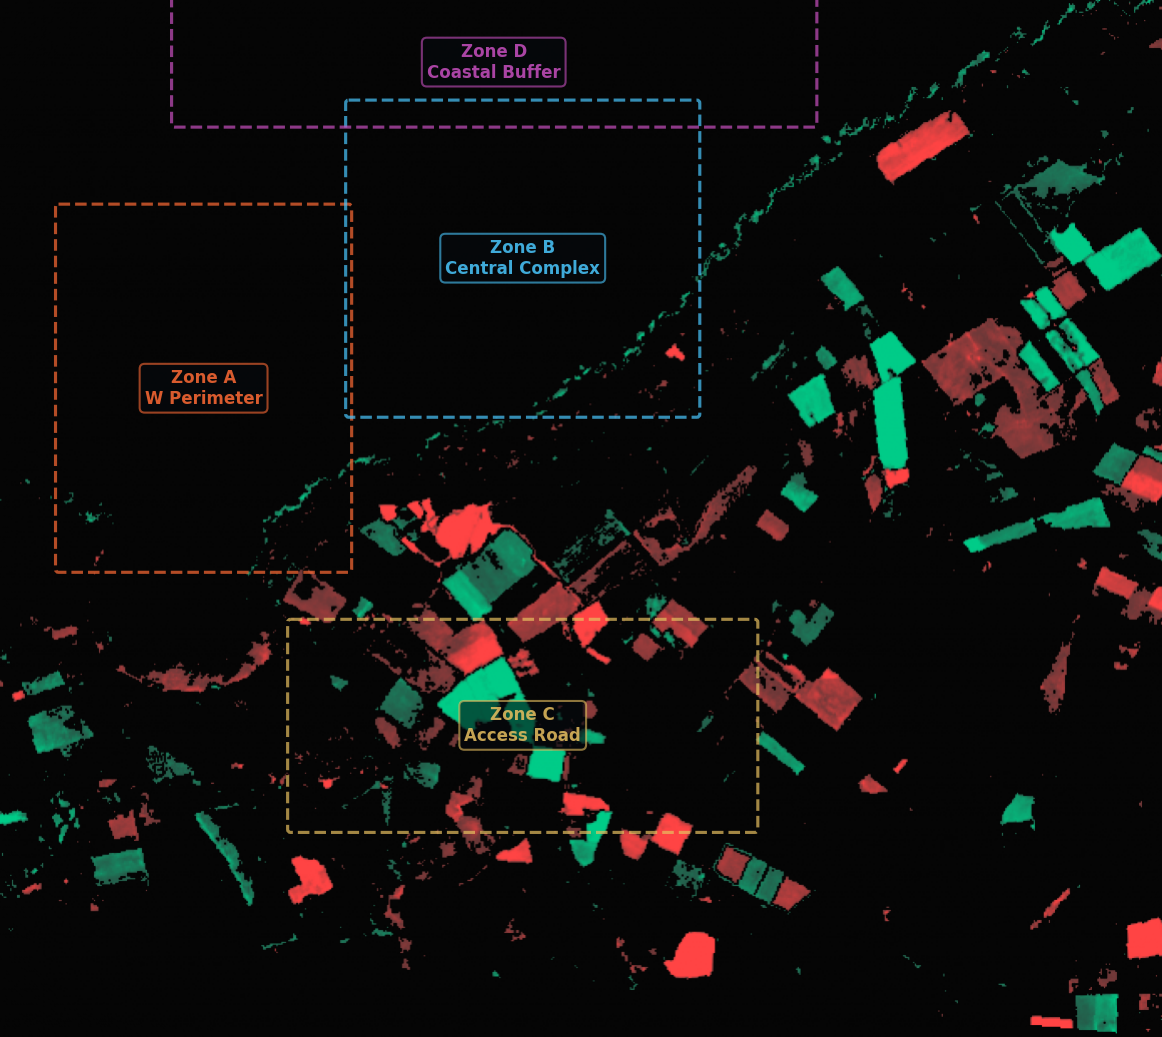
Zone A (NW Perimeter) is completely GREEN — 0% anomalous. Zone B (Central Complex) shows targeted demolition. This contrast validates the system’s sensitivity calibration.
Only 11.0% of monitored pixels (45,172 out of 409,287) show anomalous change — the lowest rate across all fully-analysed sites. The NW Perimeter is entirely GREEN (0% anomalous), confirming site stability. The Central Complex shows localised change (20.8%) consistent with targeted demolition works. The Coastal Buffer shows moderate change (14.6%) reflecting the harsh North Atlantic environment.
Dounreay proves that satellite monitoring correctly differentiates site activity levels. A decommissioning site in managed decline shows 11% change vs 51% at an active mega-construction site. This calibration is essential for automated alerting — the system needs to know what ‘normal’ looks like for each site category. For the NDA, this means reliable monitoring across their entire estate, from active sites to dormant ones.
Localised demolition activity. 20.8% anomalous with high magnitude — consistent with targeted building removal.
Completely stable. 0% anomalous pixels. Confirms site boundary integrity.
11.0% anomalous change at Dounreay — stable decommissioning site confirms baseline monitoring capability
High confidence: low anomaly rate (11%) means most of the site is within normal parameters. The detected changes in the Central Complex are concentrated and high-magnitude, suggesting genuine targeted activity rather than noise.
Localised demolition activity. 20.8% anomalous with high magnitude — consistent with targeted building removal.
Completely stable. 0% anomalous pixels. Confirms site boundary integrity.
Result produced by established remote sensing techniques (NDVI, band math). Well-proven, peer-reviewed methods.
Discovery Phase capability. Uses AI foundation models or requires ground-truth calibration. Indicates direction of travel.