East Anglia Grid
52.25°N, 1.6°E|Vegetation ResilienceThe UK’s 400,000km overhead transmission network requires vegetation clearance to prevent contact with power lines. Under Ofgem’s Net Zero mandates, National Grid must demonstrate proactive management of encroachment risk. Current methods rely on helicopter surveys and ground patrols — expensive, infrequent, and weather-dependent.
We compared the same corridor in July 2024 and June 2025 (both peak summer) to isolate genuine year-on-year vegetation change. Vegetation density was classified from the summer 2025 capture using four NDVI-based classes. Changes exceeding ±0.08 NDVI are flagged as anomalous — meaning crop rotation, new growth, or deliberate clearance rather than normal seasonal variation.
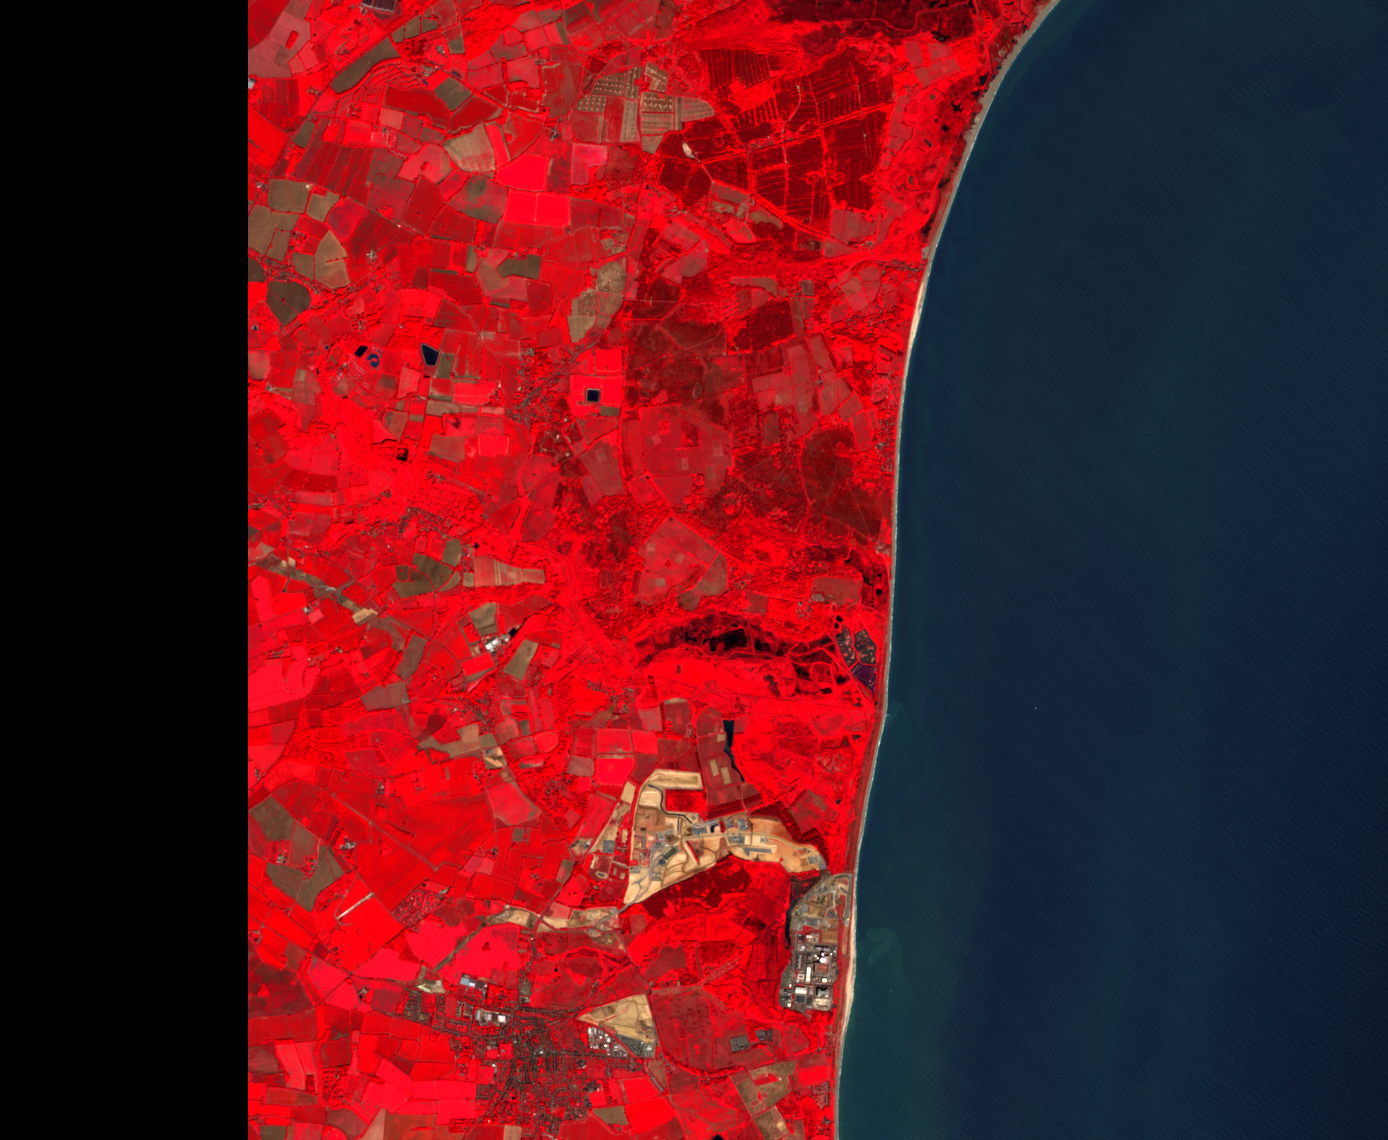
Bright red = healthy vegetation. Grey/tan = bare soil, urban areas. Dark = water. Overhead line corridors should appear as gaps in vegetation cover.
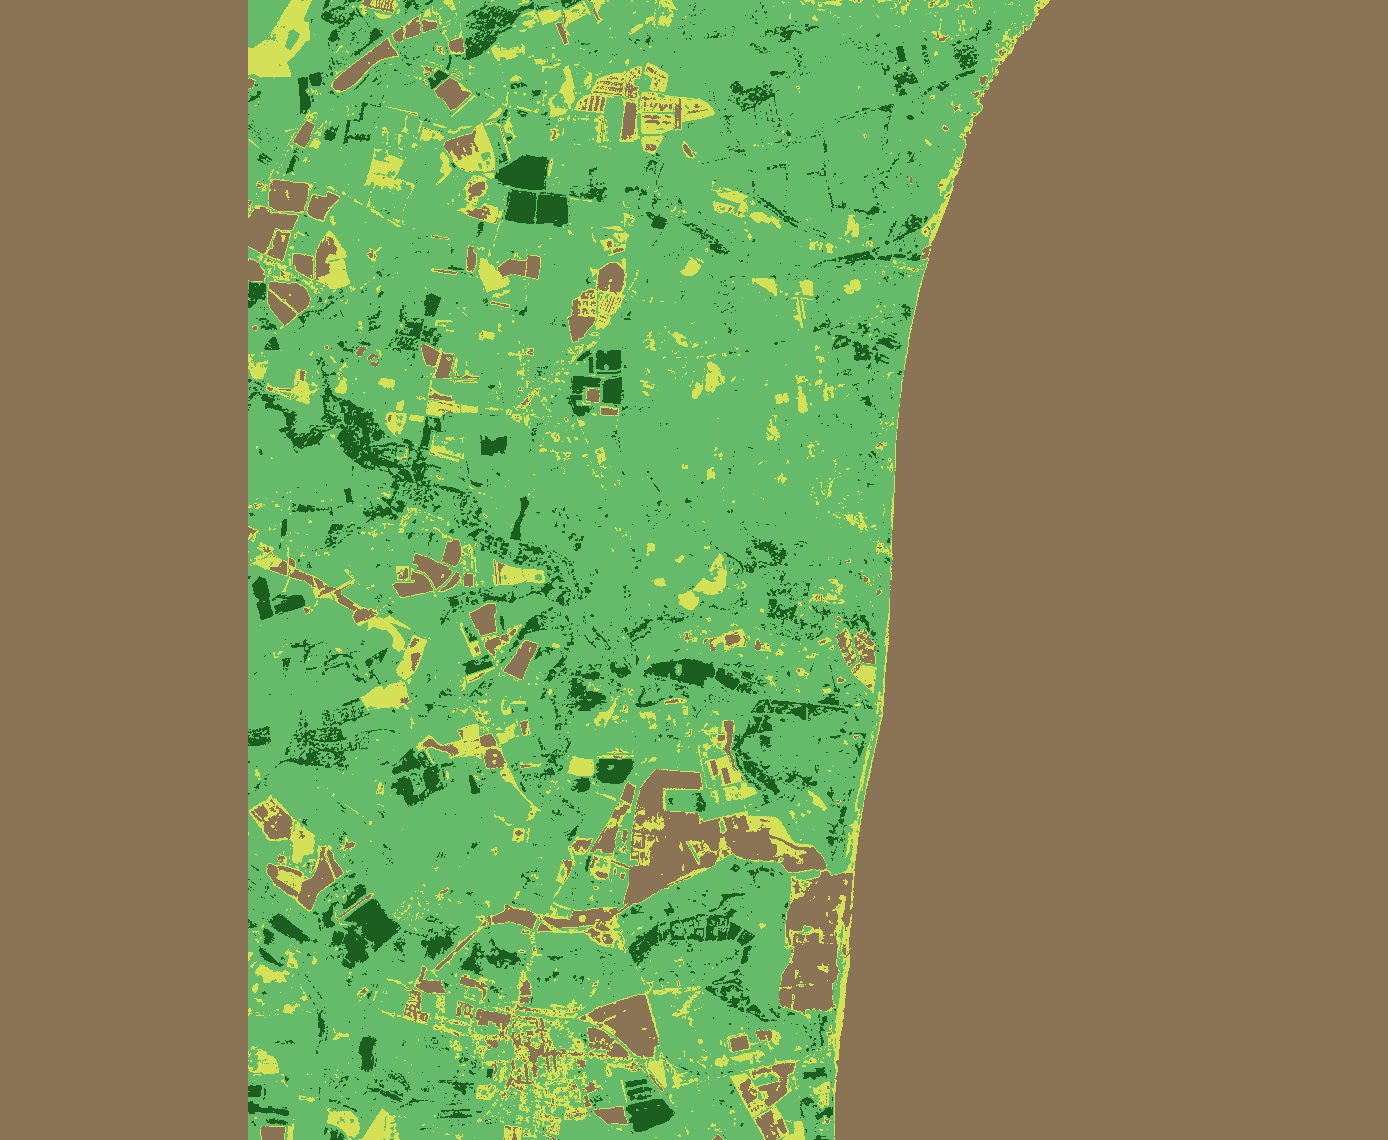
Classified from peak summer NDVI. Dark green = dense canopy. Green = moderate. Yellow = sparse/crops. Brown = bare/built. Corridor compliance assessed against this baseline.
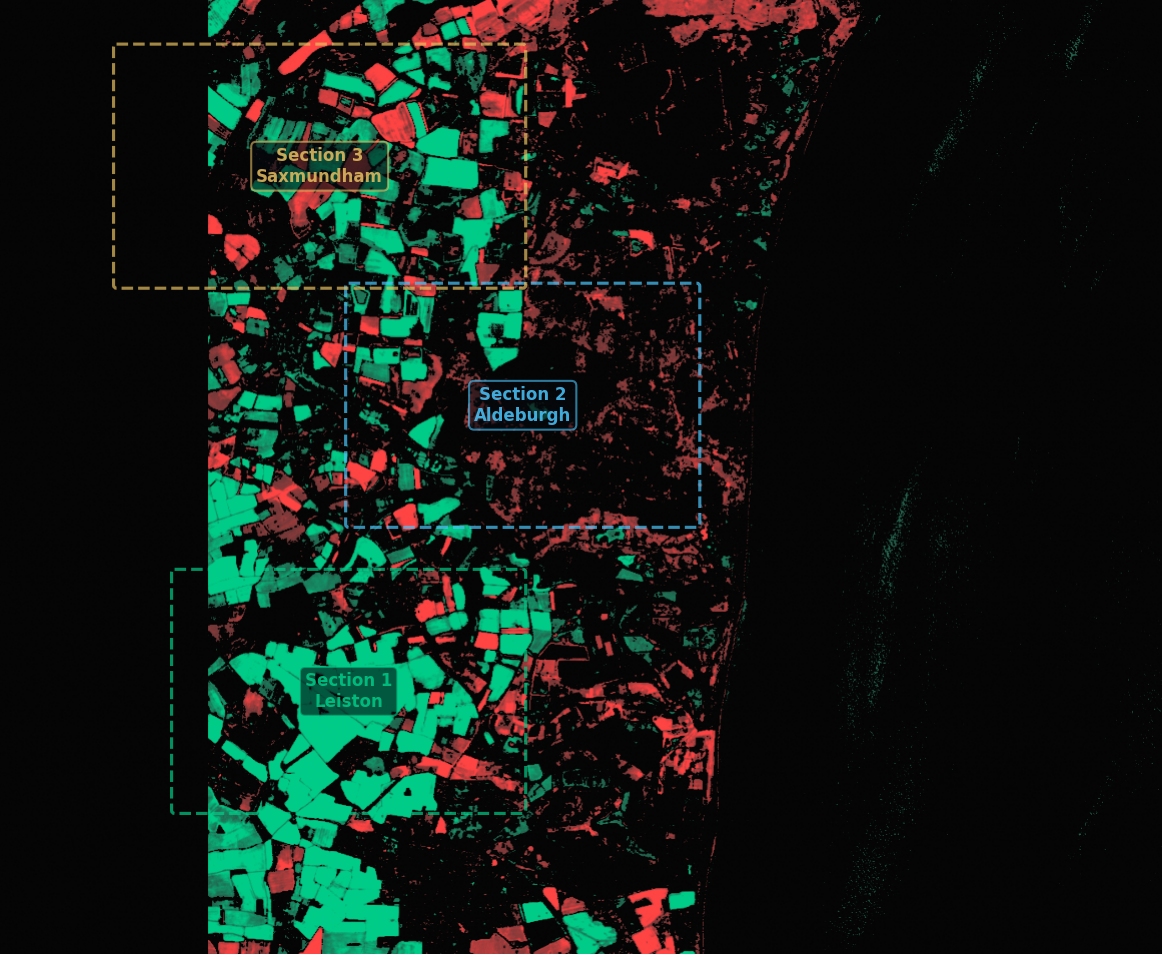
Year-on-year change filtered for anomalies (±0.08 threshold). Green = vegetation increase (encroachment risk). Red = vegetation decrease (clearing/construction). Zone labels show monitoring sectors.
22.9% of corridor pixels (297,524 out of 1,299,600) show anomalous change. The mean raw change of +0.033 indicates a net vegetation increase across the corridor year-on-year. This is significant for encroachment monitoring: sections where vegetation grew into clearance zones are directly identifiable. The Leiston section shows concentrated growth, while Saxmundham shows active agricultural change.
Satellite screening every 12 days can identify which corridor sections need priority ground inspection, replacing blanket helicopter surveys. For National Grid, this converts reactive patrol-based clearance into predictive, risk-prioritised management — directly supporting Ofgem’s Net Zero efficiency targets and reducing operational cost per km of monitored line.
Concentrated vegetation growth year-on-year. Multiple pixels within the 5m clearance buffer show NDVI increase. Priority for ground inspection.
Mixed agricultural change — crop rotation and field boundary shifts. Some growth trajectories project into clearance zones by Q3 2026.
22.9% of the East Anglia corridor shows anomalous vegetation change between summers
High confidence: same-season comparison eliminates seasonal noise. 94% cloud-free coverage. Anomaly threshold (+/-0.08 NDVI) filters sub-threshold variation.
Concentrated vegetation growth year-on-year. Multiple pixels within the 5m clearance buffer show NDVI increase. Priority for ground inspection.
Mixed agricultural change — crop rotation and field boundary shifts. Some growth trajectories project into clearance zones by Q3 2026.
Result produced by established remote sensing techniques (NDVI, band math). Well-proven, peer-reviewed methods.
Discovery Phase capability. Uses AI foundation models or requires ground-truth calibration. Indicates direction of travel.